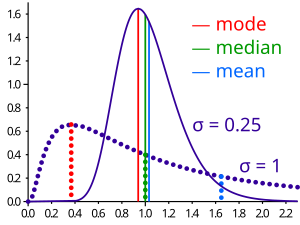
the median satisfies: \(\operatorname{P}(X\leq m) = \operatorname{P}(X\geq m)=\int_{-\infty}^m f(x)\, dx=\frac{1}{2}.\)
众数
数据的离散程度分析
方差
mean square error: \[\operatorname{MSE}(\overline{X})=\operatorname{E}((\overline{X}-\mu)^2)=\left(\frac{\sigma}{\sqrt{n}}\right)^2= \frac{\sigma^2}{n}\] where \(\sigma^2\) is the population variance.
标准差
极差
离差
平均离差
mean absolute deviation: \(\frac{1}{n}\sum_{i=1}^n |x_i-m(X)|.\)
离差平方和
变差系数
数据的分布
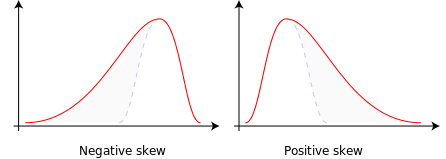
偏度(skewness)
skewness is a measure of the asymmetry of the probability distribution of a real-valued random variable about its mean. The skewness value can be positive or negative, or even undefined.
The skewness is also sometimes denoted \(\operatorname{Skew}[X]\). The formula expressing skewness in terms of the non-central moment \(\operatorname E[X^3]\) can be expressed by expanding the previous formula, \[
\begin{align}
\gamma_1
&= \operatorname{E}\left[\left(\frac{X-\mu}{\sigma}\right)^3 \right] \\
& = \frac{\operatorname{E}[X^3] - 3\mu\operatorname E[X^2] + 3\mu^2\operatorname E[X] - \mu^3}{\sigma^3}\\
&= \frac{\operatorname{E}[X^3] - 3\mu(\operatorname E[X^2] -\mu\operatorname E[X]) - \mu^3}{\sigma^3}\\
&= \frac{\operatorname{E}[X^3] - 3\mu\sigma^2 - \mu^3}{\sigma^3}.
\end{align}\]
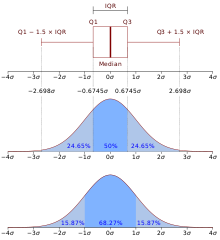
The “interquartile range”, abbreviated “IQR”, is just the width of the box in the box-and-whisker plot. That is, IQR = Q3 – Q1. The IQR can be used as a measure of how spread-out the values are. Statistics assumes that your values are clustered around some central value. The IQR tells how spread out the “middle” values are; it can also be used to tell when some of the other values are “too far” from the central value. These “too far away” points are called “outliers”, because they “lie outside” the range in which we expect them.
(Why one and a half times the width of the box? Why does that particular value demark the difference between “acceptable” and “unacceptable” values? Because, when John Tukey was inventing the box-and-whisker plot in 1977 to display these values, he picked 1.5×IQR as the demarkation line for outliers. This has worked well, so we’ve continued using that value ever since.)
Adjusted box plots are intended for skew distributions. They rely on the medcouple(??) statistic of skewness. For a medcouple value of MC, the lengths of the upper and lower whiskers are respectively defined to be \[1.5 \times IQR \times e^{3 MC}, ~\qquad~ 1.5 \times IQR \times e^{-4 MC} \text{if} MC \geq 0\] and \[1.5 \times IQR \times e^{4 MC}, ~\quad~ 1.5 \times IQR \times e^{-3 MC} \text{if} MC \leq 0.\] Observe that for symmetrical distributions, the medcouple will be zero, and this reduces to Tukey’s boxplot with equal whisker lengths of \(1.5 \times IQR\) for both whiskers.
散点图(scatter plot)
Given a set of variables X1, X2, … , Xk, the scatter plot matrix contains all the pairwise scatter plots of the variables on a single page in a matrix format. That is, if there are k variables, the scatter plot matrix will have k rows and k columns and the ith row and jth column of this matrix is a plot of Xi versus Xj.
Matlab 的 plotmatrix 函数
plotmatrix(X,Y) creates a matrix of subaxes containing scatter plots of the columns of X against the columns of Y. If X is p-by-n and Y is p-by-m, then plotmatrix produces an n-by-m matrix of subaxes.
平行坐标图(parallel coordinate plot)
探索性空间数据分析(ESDA):探索性数据分析(EDA)在空间数据分析(SDA: Spatial Data Analysis)领域的推广。将数据的统计分析和地图定位紧密结合在一起。